Core Concepts
This page digs into the underlying concepts of how Langfuse structures and captures your data. Understanding these will make debugging and working with traces easier.
Ready to start? Check out the Get Started guide to ingest your first trace.
Observations, Traces, and Sessions
Langfuse organizes an application's data into three core concepts: observations, traces, and sessions.
Observations & Traces
Observations are the individual steps of your application: LLM calls, tool calls, retrieval steps, and so on. They can be nested to reflect the structure of your application, and Langfuse supports several LLM-specific observation types such as generations and events.
A trace represents a single request or operation, for example one chatbot interaction from the user's question to the final response. It is the logical grouping of all observations that share the same trace_id.
Trace-level attributes such as user_id, session_id, tags, and metadata live on every observation within the trace; the SDKs propagate them automatically. Conceptually, Langfuse stores one observations table, and each row holds the observation-level data plus a copy of the trace-level attributes. This keeps queries and aggregations fast:
| Observation-level data | Trace-level data · on every row | ||||||
|---|---|---|---|---|---|---|---|
| id | type | name | latency | trace_id | trace_name | user_id | session_id |
| obs-1 | span | handle-chat | 3.1s | abc123 | chat-request | u-42 | s-7 |
| obs-2 | span | retrieval | 0.4s | abc123 | chat-request | u-42 | s-7 |
| obs-3 | generation | llm-call | 2.6s | abc123 | chat-request | u-42 | s-7 |
| obs-4 | span | build-report | 1.2s | def789 | export-report | u-17 | s-9 |
| obs-5 | generation | summarize | 0.9s | def789 | export-report | u-17 | s-9 |
Sessions
Optionally, traces can be grouped into sessions. Sessions are used to group traces that are part of the same user interaction. A common example is a thread in a chat interface.
Example session in Langfuse UI
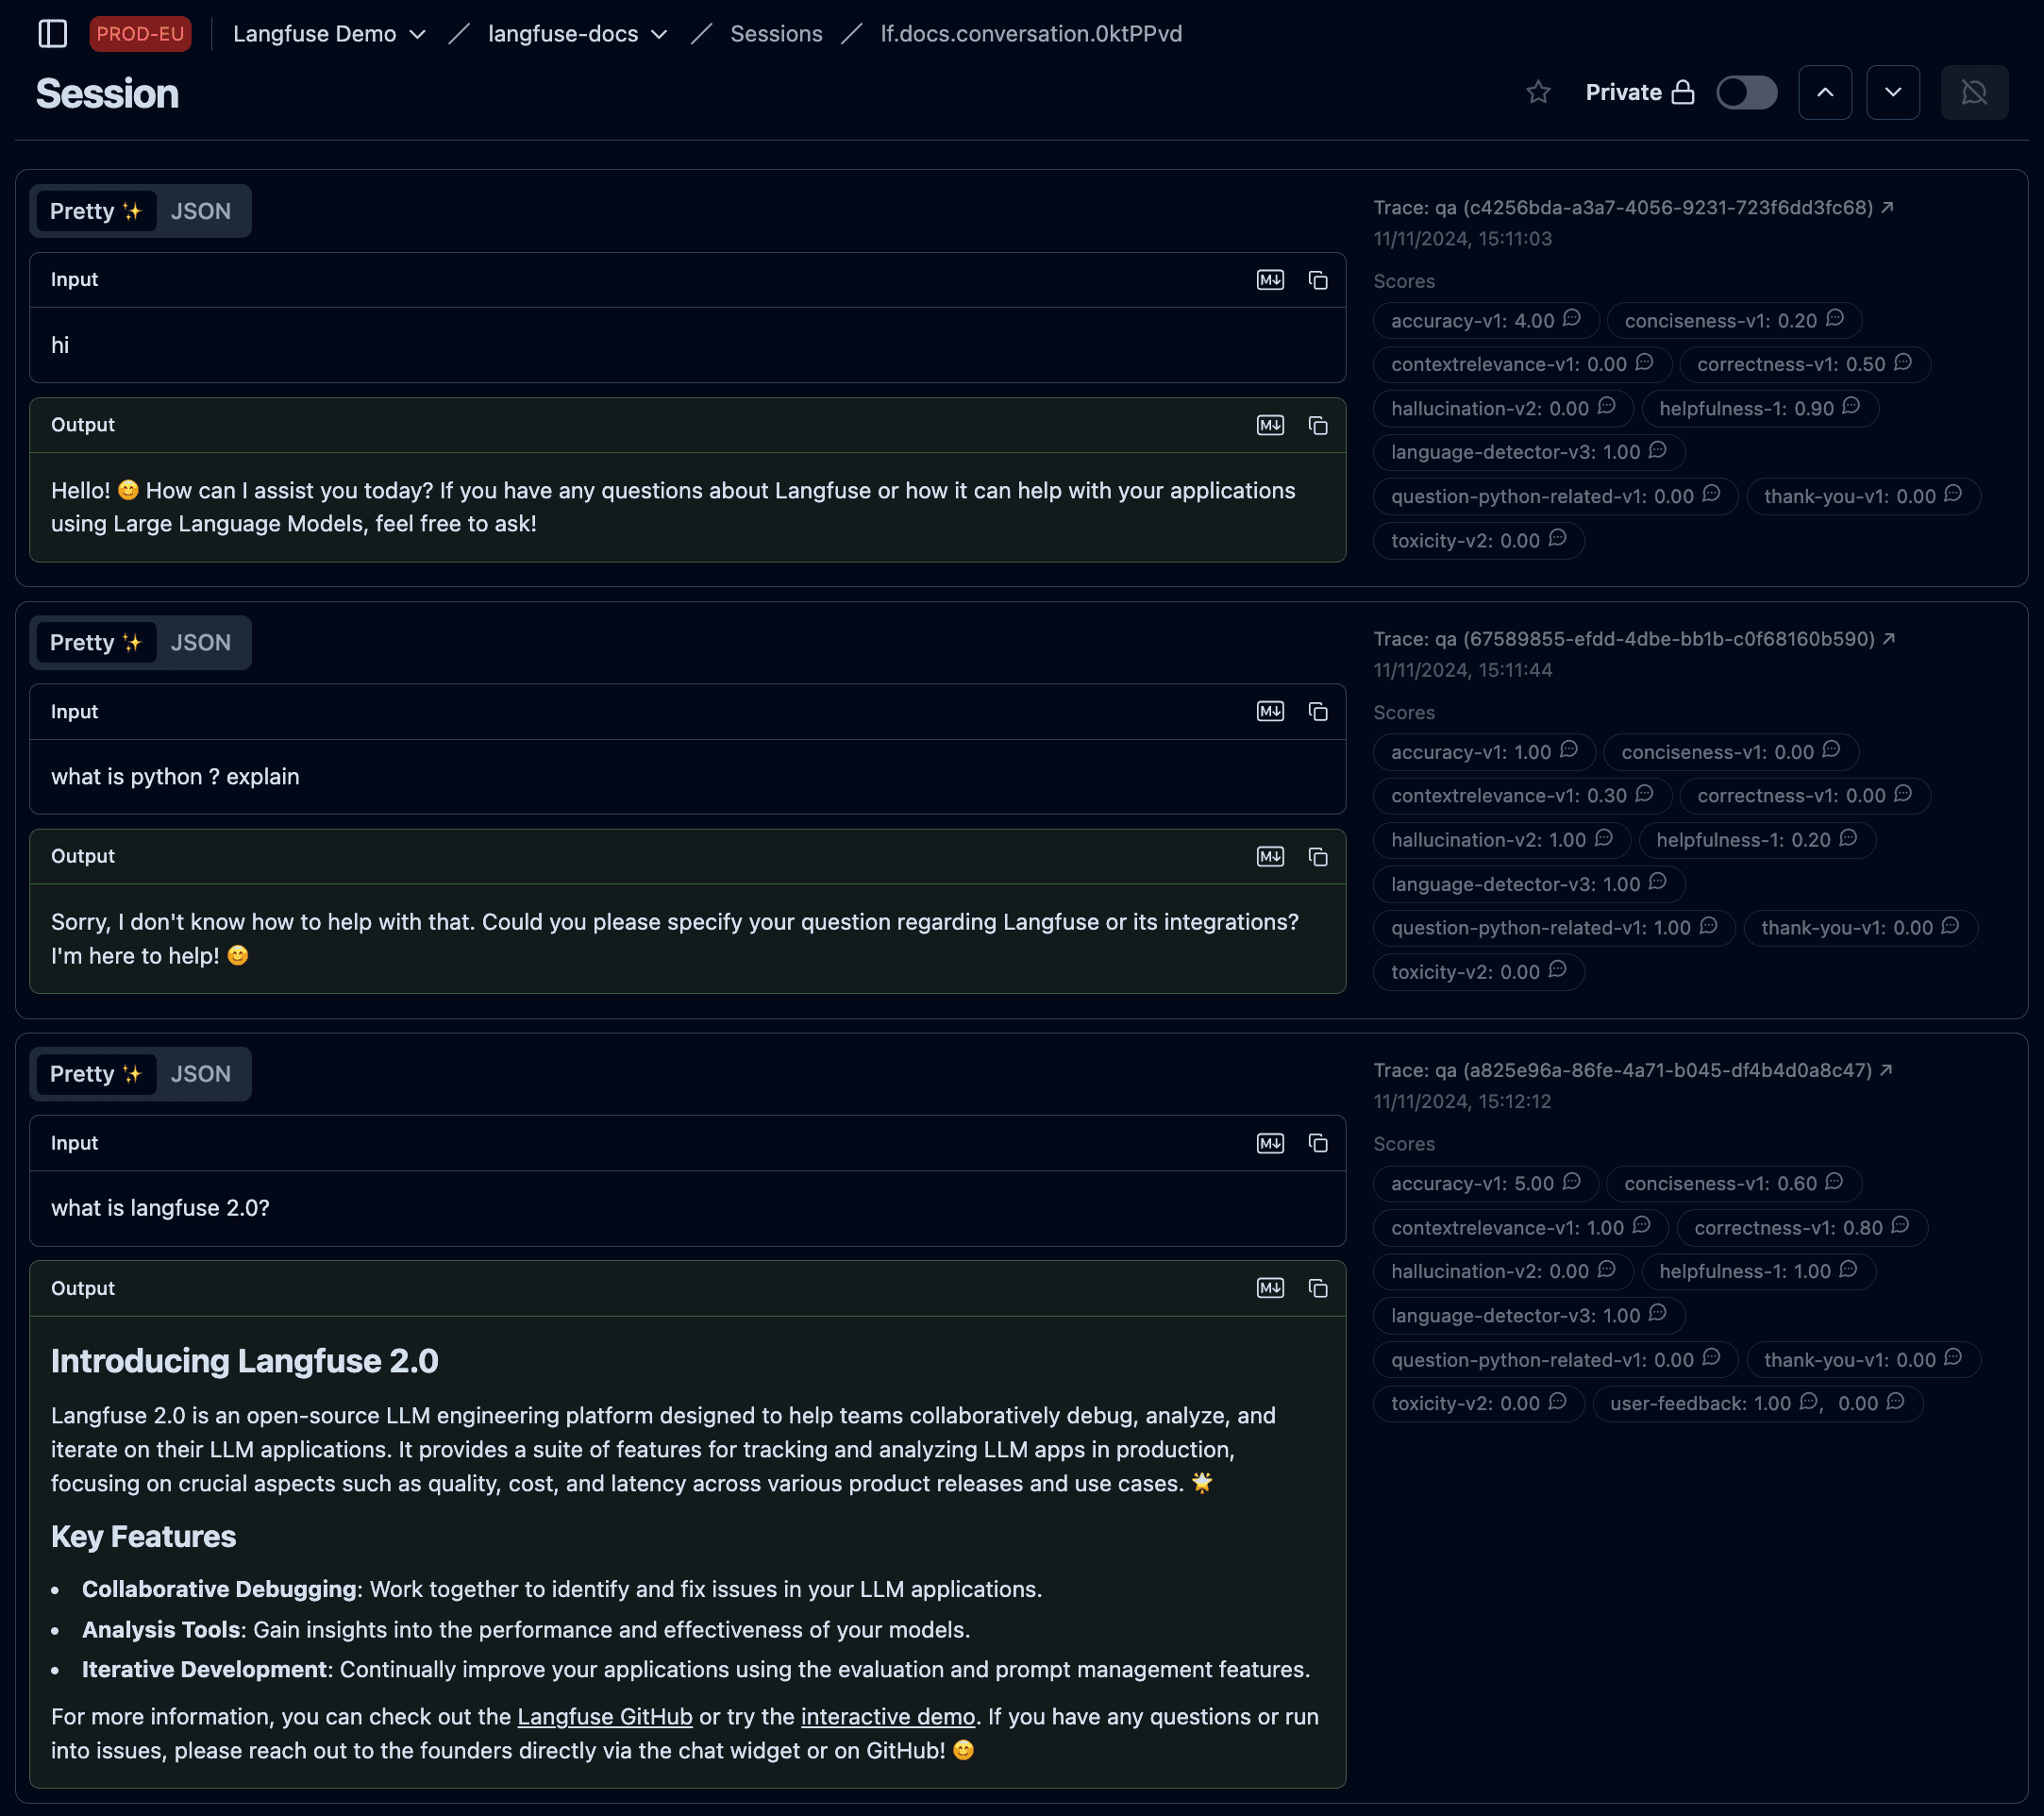
Using sessions is recommended for applications with multi-turn conversations or workflows. Please refer to the Sessions documentation to add sessions to your traces.
Adding Attributes
Once you've structured your data into traces and observations, you can enrich them with additional attributes. These attributes act as labels that help you filter, segment, and analyze your traces for specific use cases.
There are different types of attributes you can add:
| Attribute | Description |
|---|---|
| Environments | Separate data from different deployment contexts like production, staging, or development |
| Tags | Flexible labels to categorize traces by feature, API endpoint, or workflow |
| User | Track which end-user triggered each trace |
| Metadata | Flexible key-value store for custom information |
| Releases & Versions | Track application versions and component changes |
How Langfuse Captures Data
Now that you understand the data model, let's explore how Langfuse actually captures and processes your traces.
Built on OpenTelemetry
Langfuse is built on OpenTelemetry, an open standard for collecting telemetry data from applications.
This means you're not locked into using only Langfuse-specific SDKs. You can also send your traces to multiple destinations at once, like Langfuse for LLM observability and Datadog for infrastructure monitoring.
See the OpenTelemetry integration guide for detailed documentation on integrating OpenTelemetry with Langfuse.
Instrumentation
Instrumentation is the process of adding code to your application to record what it does. Once this recording is turned on, Langfuse (through OpenTelemetry) can automatically capture these events and structure them into traces and observations.
The Get Started guide walks you through the process of instrumenting a function in your application.
Background Processing
In order to avoid slowing down your application, Langfuse doesn't send traces synchronously the moment they're created. Instead, Langfuse batches traces locally and sends them in the background, keeping your application fast and responsive.
Long-running applications
The approach above works well for long-running applications (like web servers or APIs) because the background exporter continuously runs and has plenty of time to flush batches on its own.
Short-lived applications
For applications that start, execute something, and shut down quickly (short-lived applications), there's a risk that the application terminates while there are still unsent traces in the queue.
To avoid losing data, short-lived applications must explicitly call flush() before exiting. This forces the exporter to send all buffered traces immediately, so nothing is lost when the process terminates.
Last edited


